
Canada’s diverse economy provides investment opportunities in both public and private equity. For an investor, diversification, low fees, and the use of skilled active managers can lead to improved and less volatile performance.
From health care, financials, and technology to retail, energy, and manufacturing, the Canadian equity marketplace provides investment opportunities across many industries. However, Canadian investors may not always be properly diversified across Canada’s economy. For example, if an individual uses an index-like approach benchmarked to the S&P/TSX Index to gain exposure to Canada, roughly half of the investment would be in financials and energy companies. The four largest sectors alone would make up close to three-quarters of the portfolio as shown in the pie chart below.
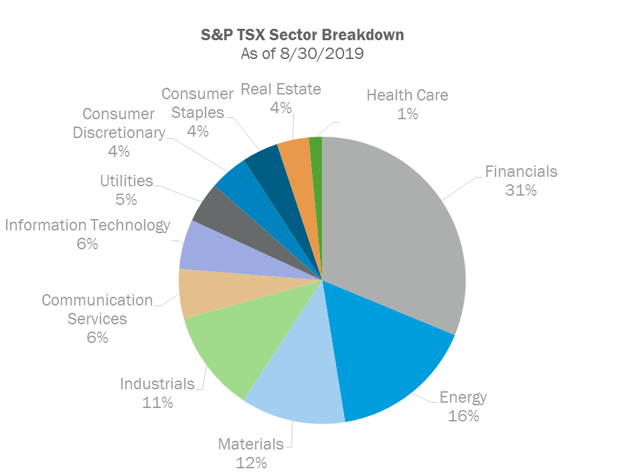
Exhibit A. Source: D&P Dow Jones Indices.
The S&P/TSX Index, the most common benchmark used for Canadian equities, has proven to be a less than ideal representation of the Canadian economy. Not too long ago in 2000, telecommunications company Nortel Networks represented a third of the TSE 300 Index (now the S&P/TSX Index) prior to its eventual bankruptcy. In today’s composition of the S&P/TSX Index, the sector weights are not necessarily representative of each sector’s economic contributions. To help reduce sector concentration risk, investors can employ active managers that invest using a benchmark-agnostic approach, and focus on value and growth opportunities across industries. The following paper discusses Canada’s growing and diverse economy, the use of active management to improve diversification, alpha opportunities, fee reduction, and the value of private equity in Canada.
In Canada’s $1.8 trillion economy, growth relative to its peers has remained strong and the drivers of growth have come from a broad range of industries. The pie chart below reflects the diversity of Canada’s GDP broken down by industry. Although financial services and oil & gas are strong contributors to output, the majority of the Canadian economy is driven by other industries. Furthermore, Canada has been growing faster than many developed nations. Real GDP growth has been higher than the U.S., the euro area, and the G7 countries (table on the following page) over the last decade and is projected to hold strong at 1.8% over the next five years.
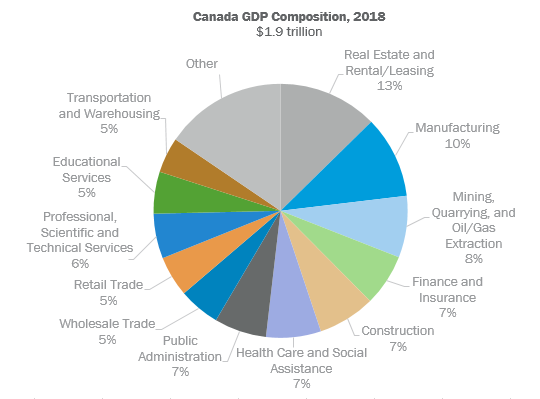
Exhibit B. Source: Statistics Canada as of December 31, 2018.
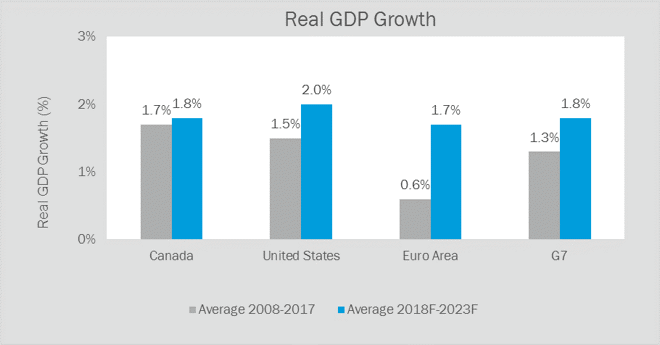
Exhibit C. Source: Statistics Canada as of December 31, 2017.
Canadian equity managers that implement a benchmark agnostic approach are not handcuffed by the sector weights of the benchmark and can invest more heavily in growing sectors such as health care, consumer discretionary, and information technology, which make up only 1.5%, 4.3%, and 5.6%, respectively, of the S&P/TSX Index. As the data has shown over the last 10- and 15-year time periods, that freedom for Canadian active managers has paid off. According to Morningstar data, the average active manager has tended to outperform its Canadian benchmark, gross of fees.
Canadian managers have outperformed the S&P/TSX Index benchmark more consistently than their U.S. manager counterparts that are benchmarked against the Russell 1000 (gross of fees). The separate account data below uses category average returns from Morningstar (methodology is a weighted-average and is free from survivorship bias). The data was used to calculate the percent of three-year periods when active managers outperformed and the average magnitude of excess returns (positive or negative) over three-year periods. The performance is calculated as rolling three-year returns with one-month shifts through 2018.
According to the data, the average Canadian equity manager has been able to outperform the S&P/TSX index 88% of the time with an average excess return of 1.1% over the 15-year time period ending in 2018. In the U.S., large cap value managers had the highest probability of success relative to their growth and blend counterparts over the last fifteen years. For 63% of the rolling 3-year time periods, the average active value manager outperformed the Russell 1000 Value Index with an average excess return of 1.1%. Unfortunately for growth and blend managers, the average excess returns were negative and the average manager outperformed around one-third of the time.
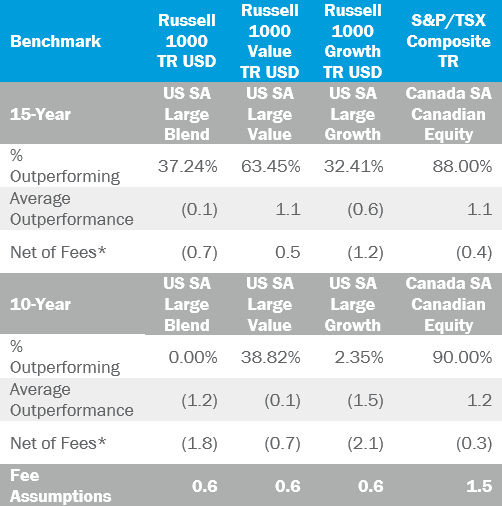
Exhibit D. Source: Morningstar as of December 31, 2018.
*Calculated using median active manager fee data from Morningstar.
The 10-year data reveals an even more challenging time period. Positive excess returns for U.S. active managers have been quite elusive in what has been the longest bull market in history. The average active blend and active growth manager outperformed their respective benchmarks 0% and 2.35% of the time. The average value manager held up better, outperforming the Russell 1000 Value around 39% of the time. For active management in Canada however, the story has been quite different. The average Canadian equity manager outperformed 90% of the time, with the underperformance concentrated in 2011 (3- year market rally after 2008) and in 2018.
Although the excess return numbers appear promising for Canadian managers, these numbers are gross of fees. In Canada, the median Canadian equity manager fee is 1.5%, well over double the median fee for a U.S. large cap manager (0.6%), according to Morningstar as of 2019. Excess returns net of the typical fee would drop into negative territory, which does not include the additional performance drags of portfolio turnover, which lead to capital gains concerns for taxable investors, and commission fees. These additional costs are crucial factors to consider when selecting a suitable manager.
For many years, expense ratios for actively managed mutual funds have fallen as growth in index fund investing and other competitive forces have continued to put increased pressure on fees. Although costs have come down in both the U.S. and Canada, the fees Canadian investors pay are still much higher. Canterbury’s goal is to research and recommend managers in Canada that meet our investment criteria of strong security selection and below-average portfolio turnover. Given the aggregate size of assets across clients that are invested with any one manager, Canterbury negotiates lower fees for our clients. Furthermore, thanks to our size, growth, and long-term investing perspective, we have been able to work with Canadian managers that provide our clients equity strategies in the fee range of 40 to 100 basis points, well below the Canadian market median manager fee of 1.5%. These managers also tend to have below average portfolio turnover, which can improve after-tax returns for the taxable investor and can lead to reduced commission costs due to less frequent trading over time. We discuss the additional costs of active management in depth in our white paper, After-Tax Returns.
We also share common goals in the U.S. Over the years, we have recommended with managers across market caps whose investment management fees are below average. All else equal, lower management fees can lead to improved excess returns, both positive and negative. Beyond the public markets, Canterbury also works with both Canadian and U.S. private equity managers that can improve diversification and enhance returns for client portfolios.
In Canada, roughly 90% of the private sector workforce (around 10.7 million Canadians) are employed by small and medium sized enterprises (SMEs), which account for 99.7% off all Canadian businesses. This is a crucial piece of the Canadian economy that accounts for slightly more than half of the value added to the country’s output. From a goods and services perspective, the average contribution from SMEs to GDP was 43.6% in the goods-producing sector and 74.5% in the service-producing sector.
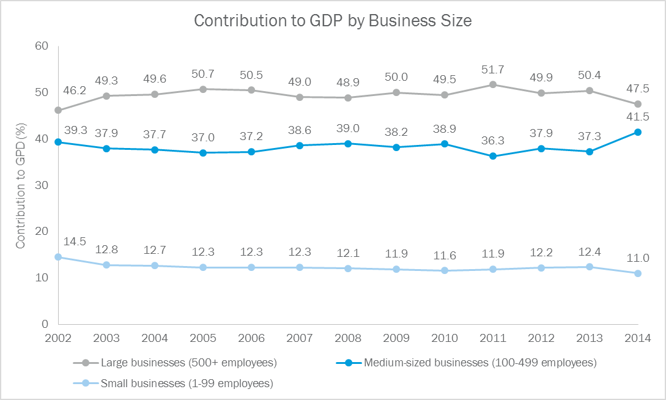
Exhibit E. Source: Statistics Canada as of December 31, 2014.
Untapped areas of Canadian innovation and growth can be found in these nonpublic SMEs that may be otherwise unavailable in the public markets. For example, the high-growth health care sector is represented by only eleven companies in the S&P/TSX Index, many of which are cannabis-related companies with little to no earnings. Whereas in the private sector, there are over 2,200 SMEs and over 300 large companies (those with 500+ employees) in health care. The professional, scientific, and technical services sector (PST), which is growing over 11%, is represented by over 1,100 mid-sized companies and over 100 large companies in the private sector, whereas the S&P/TSX Index has only eleven companies representing this expanding sector.
Canterbury seeks private equity managers that pursue profitable businesses in these growing industries that are seeking capital partners to help scale and professionalize their business. Because private equity industry is less developed in Canada, these companies tend to trade at lower purchase multiples than their American counterparts, and there is often opportunity for geographic expansion. Canterbury’s pursuit of private equity in Canada began in 2016 and we have thus far committed to three Canada-based funds with additional managers in the pipeline.
Canada’s strong and diverse economy provides opportunity for both public and private equity managers. Active management has proven to be effective. However, investors must be aware of the fees they are paying for their services. The use of both Canadian private and public equity in a portfolio can offer a well-balanced portfolio exposed to the diverse and growing Canadian investment landscape.
The comments provided herein are a general market overview and do not constitute investment advice, are not predictive of any future market performance, and do not represent an offer to sell, or a solicitation of an offer to buy, any security. Similarly, this information is not intended to provide specific advice, recommendations, or projected returns. The views presented herein represent good faith views of Canterbury Consulting as of the date of this communication and are subject to change as economic and market conditions dictate. Though these views may be informed by information from sources that we believe to be accurate, we can make no representation as to the accuracy of such sources or the adequacy and completeness of such information.