Dispersion of Returns: An Analysis of Risk/Return Profiles of Private Capital Sub-Strategies
Canterbury frequently receives client questions about the risk/return profile of private capital sub-strategies. While there are many ways to approach the question, this blog post uses the range of returns between top and bottom quartile funds as well as standard deviation to provide context.
Data Set
Canterbury utilized data as of the most recent reporting quarter with internal rate of return (IRR) as of November 16, 2020. The total data set is 3,368 funds raised between 2002 and 2017, as performance data for funds raised in 2018 or later is not yet as meaningful.
Rationale and Performance Data
Private capital managers update valuations for portfolio companies on a quarterly basis, relative to public market investments that are constantly marked to market. This infrequent performance data means that traditional methodologies to calculate volatility and risk-adjusted return, most notably the Sharpe Ratio, are less meaningful.
The graph below shows the range between the first and fourth quartile and the standard deviation for each private capital sub-strategy that Canterbury recommends. The range is calculated as the difference between the threshold for first quartile and fourth quartile. For example, fourth quartile venture funds were a net IRR of 0.8% or lower, while first quartile venture funds were a net IRR of 19.9% or higher for a range of 19.1%.
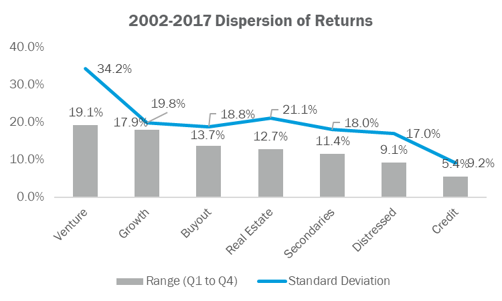
Exhibit A. Source: PitchBook as of November 16, 2020.
The dispersion of returns only tells part of the overall story. The table below provides the numbers behind the data, ordered by median net IRR.
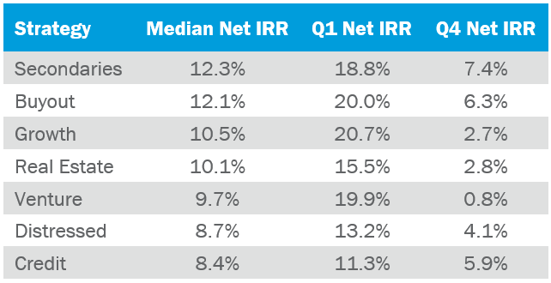
Exhibit B. Source: PitchBook as of November 16, 2020.
Key Findings
- Real estate, growth, buyout, secondaries, and distressed are all relatively similar (between 17.0% and 21.1%) from the perspective of standard deviation. The standouts are venture capital and credit at 34.2% and 9.2%, respectively. This is intuitive given the type of investing that both strategies are executing. Venture invests in equity, the more risky part of the capital structure, at the early stages of a company’s lifecycle. Meanwhile, credit strategies invest in debt, the more senior part of the capital structure, typically in more mature companies.
- Secondaries funds have generated the highest median net IRR in addition to the third lowest dispersion range. This consistency means that while secondaries funds are unlikely to be home runs, they are also less likely to produce a negative outcome. Canterbury notes that the nature of secondaries investing generally results in a lower multiple than other strategies.
- Venture funds have the third lowest median net IRR, in addition to the highest dispersion and standard deviation. Manager selection in the venture space is therefore crucial, as an investor must allocate consistently to top quartile (or even decile) funds to outperform other strategies. In connection with the high predictability of future performance based on past performance, discussed in a previous blog post (Why Do Investors Choose Fund of Funds?), fund of funds are a good option for investors seeking diversified venture exposure.
- Top quartile growth funds have outperformed the top quartile of all other sub-strategies, in addition to a median net IRR that only trails buyout and secondaries. Growth strategies are able to take advantage of strong market conditions, while also somewhat mitigating risk in downturns due to lower leverage on portfolio companies.
Conclusion
In aggregate, this analysis speaks to the importance of diversification within private capital portfolios. Investors with a lower risk appetite can allocate more capital to credit, distressed, and secondaries strategies, while those seeking a higher risk/return can instead increase exposure to venture and growth.
