
This article is an educational starting point to understand the most used inflation indicators: CPI and PCE. A great deal of econometrics and statistical methods are used in the formation of these indexes. While this article does not cover these methods in detail, the goal is to outline the general composition of inflation indicators.
The most commonly used inflation indicators are the Consumer Price Index (CPI) and the Personal Consumption Expenditures Price Index (PCE). The CPI is produced by the Bureau of Labor Statistics and the underlying weights are based on Consumer Expenditure Surveys taken from households on frequently purchased items, which is compiled by the Census Bureau. The PCE Index is produced by the Bureau of Economic Analysis and the underlying weights are based on various business surveys on consumer purchasing habits, which is also compiled by the Census Bureau. The indexes are usually quoted on a year-over-year (YoY) basis, meaning that inflation is measured by the change in the price level over a trailing 12-month period.
Both indexes are used to measure inflation and are monitored by investors and monetary authorities to make decisions. As a result, both headline and core inflation are closely watched. Headline inflation measures the change in the value of goods and services while core inflation measures the change in the value of goods and services excluding food and energy. Core inflation excludes food and energy because prices for both categories tend to be volatile and distort the overall change in the price level during certain periods. For example, during 2014–2015 the price of crude oil dropped by more than 50% from a price level above $100, which largely affected headline CPI (see Exhibit A). While headline CPI fell drastically during this period, core CPI was little changed. This is a good example of how core inflation can be a helpful measure of the overall price level of goods and services during periods of volatility for food and energy.
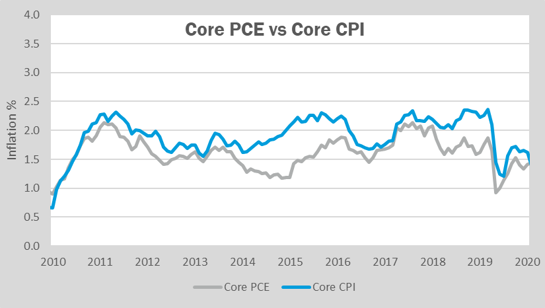
Exhibit A. Source: Federal Reserve Bank of St. Louis
The CPI’s underlying weights are based on a fixed basket of goods and services that represents out-of-pocket expenditures by consumers in which data is collected through various Consumer Expenditure Surveys by the Census Bureau. The basket is fixed for two years until it is reevaluated through more relevant household spending surveys. The CPI index is available for two population groups, Urban Consumers (CPI-U) and Urban Wage Earners and Clerical Workers (CPI-W). CPI-U is the index that is mainly referenced by the financial media and industry professionals as it represents a large portion of the population (approximately 93%1.
The PCE Index reflects expenditures made by households and non-profits on the behalf of households. The PCE’s underlying weights reflect aggregate consumer expenditures across the nation and are not determined by a fixed basket of goods and services such as the CPI. Data is compiled by the Census Bureau through various business surveys on a monthly, quarterly and annual basis. The data collected for the PCE is also used to calculate the consumer spending portion of Gross Domestic Product (GDP).
Given these differences, the underlying weights are shown below (Exhibits B and C). The largest weighting difference between the two indexes is the housing/shelter component. Within core CPI, shelter represents approximately 42% of the index while housing and utilities represent approximately 20% of core PCE (as of December 31, 2020).
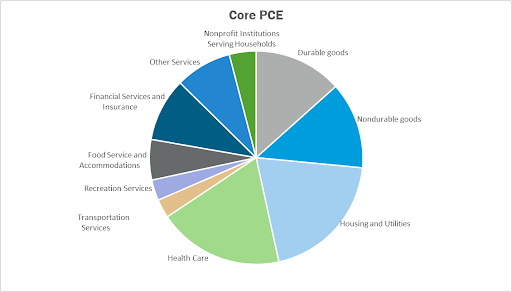
Exhibit B. Source: Bureau of Economic Analysis as of December 31, 2020.
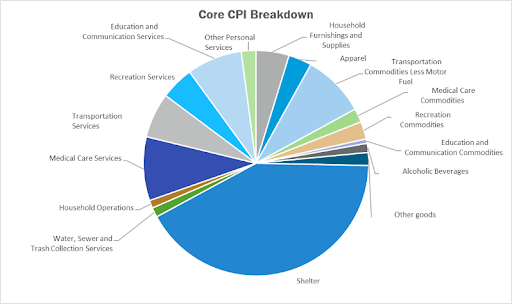
Exhibit C. Source: Bureau of Labor Statistics as of December 31, 2020.
With the wide disparity in composition between the two indexes, the reported YoY changes in the price levels are naturally different from one another. For example, during the 2014–2015 time period, core CPI showed a 90 basis point (0.9%) difference relative to core PCE at its peak (see Exhibit D). During this same period, the CPI’s fixed basket saw a large increase in YoY price levels of about 2.1% while the PCE index increased at a much slower rate of about 1.2%.

Exhibit D. Source: Federal Reserve Bank of St. Louis
The last notable difference between the two indexes is due to the underlying calculation. The CPI uses a Laspeyres formula which, generally speaking, measures the difference in prices of a fixed basket during a specified period. The PCE index uses a Fisher Ideal formula which takes into account the Laspeyres formula and the Paasche formula. When combined, the formulas incorporate changes in price levels and changes in quantity of consumption. Changes in the quantity are important to note because it reflects the substitution effect that arises when a price of a good or service increases. For example, if the price of steak increases, consumption will likely decrease while consumption for chicken will likely increase. Therefore, the PCE index can be seen as a more helpful real-time indicator because it continuously takes into account the changes in consumer preferences while the CPI does not reflect these changes until it is reevaluated after every two years.
To summarize the main points mentioned, the CPI and PCE Index are the most widely used inflation indicators. Headline and core inflation are both reported for each index to better reflect changes in the overall price levels, excluding the volatile prices of food and energy. Simply categorized, the main differences between the two indexes are a result of the weight, formula, and scope effect (the difference in survey responders). The fourth category difference is considered to be the “other effect,” which is a result of seasonal adjustments and/or other statistical method differences.
No index is better than the other. The CPI measures the change in prices for a fixed basket of goods and services while the PCE index measures the change in price and quantity of goods and services consumed on a continuous basis. Investors and the financial media tend to focus on CPI while the Federal Reserve and other public institutions tend to focus on the PCE Index. For investors, it is probably best to use both when gauging the general level of inflation as it helps paint a larger picture of the overall price level. In the next blog post, we will cover the recent trends in inflation as well as the ongoing debate between proponents of inflation and deflation.
Disclosure:
The comments provided herein are a general market overview and do not constitute investment advice, are not predictive of any future market performance, and do not represent an offer to sell, or a solicitation of an offer to buy, any security. Similarly, this information is not intended to provide specific advice, recommendations, or projected returns. The views presented herein represent good faith views of Canterbury Consulting as of the date of this communication and are subject to change as economic and market conditions dictate. Though these views may be informed by information from sources that we believe to be accurate, we can make no representation as to the accuracy of such sources or the adequacy and completeness of such information.
Sources:
1 https://www.bls.gov/
2 https://www.bea.gov/
3 https://fred.stlouisfed.org/